- Cloud interface
- Manage screen
- Dashboards
- Widgets
Aggregate Tag Value
Features common to all Widgets and general Dashboard info can be found on the Widgets section of the manual.
General Dashboard and Widget info#
Features common to all Widgets and general Dashboard info can be found on the Widgets section of the manual.
Description#
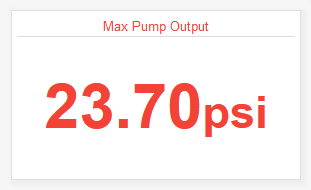
The eze.io Aggregated Tag Value widget processes multiple data points with the same tag, to produce a singe value. Aggregation options include; average, sum, minimum, and maximum. This widget is designed for live/instantaneous values. These values could be rapidly changing such as a power reading (kW) or slow like a tank level.
Minimum height - 2 grid units
Features / Options#
- Numeric value shown with unit
- 4 Aggregation setting (Avg., Sum, Min., Max.,
Settings#
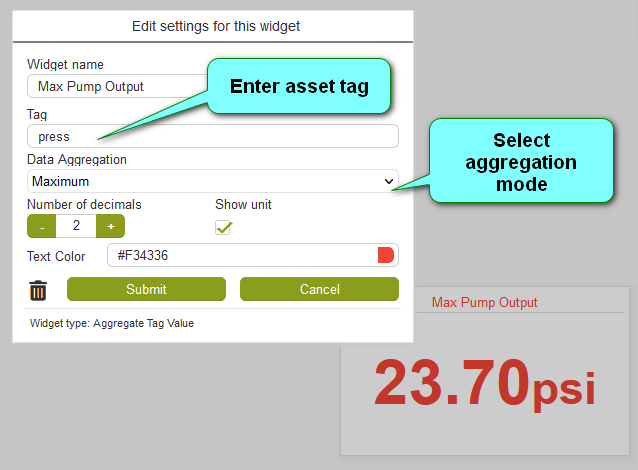
Widget name#
Appears top and center of widget
Tag#
Enter the “Asset tag” that was assigned to the Fields to be aggregated. For more information on this linking method see the mapping section on the widgets page.
Data Aggregation#
A drop-down-menu allows the user to select one of the four data aggregation options described below
- Average - Assign the same tag to two or more Fields and the widget will display the average
- Sum - All Fields with the same tag will added together to produce a total
- Minimum - The lowest value out of all of the Fields with the tag will be displayed
- Maximum - The highest value out of all of the Fields with the tag will be displayed
Text color#
Click on the color swatch to access the color palette and select a color for the range bar
Last updated Sep 24, 2021