- Cloud interface
- Manage screen
- Dashboards
- Widgets
Bar Graph
Features common to all Widgets and general Dashboard info can be found in the Dashboards section of the manual.
General Dashboard and Widget info#
Features common to all Widgets and general Dashboard info can be found in the Dashboards section of the manual.
Description#
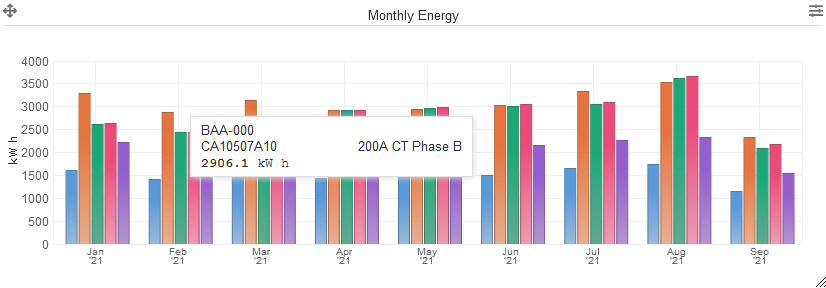
The eze.io Bar Graph widget displays total accumulation over a user selected time frame, ranging from hourly to monthly. Up to 5 data points can be tracked. This widget is best suited for comparing or tracking usage, for example water or energy.
Minimum height (grid units) - 3
Features / Options#
- Up to 5 data points
- 7 User selectable time frames
- Selectable timeline cutoff (“Do not show data before this date”)
Settings#
Widget name#
Appears top and center of widget
Select Bar Diagram Type#
Select field/s#
Five drop down menus provide the means to link to a specific “Field”, from the desired ezeio. For more details see the “Point to Field” section of the Widget page.
Select Bar Width and Time Scale#
Drop down menu offer the graphical styles listed below
- Hourly, for 24 hours
- 4 Hours, for 4 days
- Daily, for 10 days
- Daily, for 30 days
- Weekly, for 1 year
- 4 weeks, for 2 years
- Calendar month, for 2 years
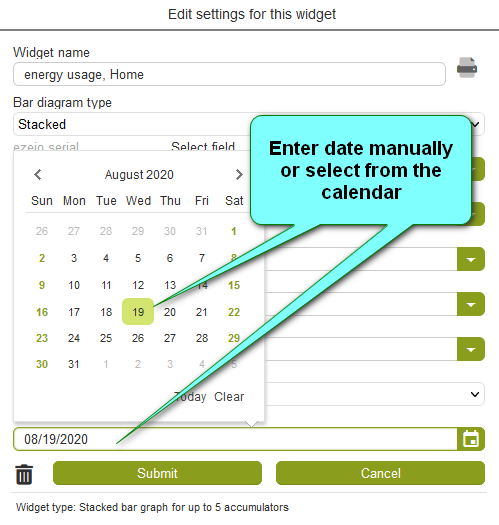
Do not show data before this date#
Sets a cutoff date, so older data is not displayed on the chart
Last updated Sep 24, 2021